using TyPlot
using TyMath
wm = 1;
wc = 1.1wm;
Ts = 0.7pi/wm;
ws = 2pi/Ts;
n = -100:100;
nTs = nTs;
f = sinc.(nTs/pi);
Dt = 0.005;
t = -15:Dt:15;
t_vector = collect(t);
nTs_matrix = repeat(nTs, 1, length(t_vector));
t_matrix = repeat(t_vector', length(nTs), 1);
fa = f .* Ts * wc/pi .* sinc.((wc/pi) .* (t_matrix .- nTs_matrix));
sinc_t = sinc.(t / pi);
sinc_t_matrix = repeat(sinc_t', length(nTs), 1);
error = abs.(fa .- sinc_t_matrix);
t1=-15:0.5:15;
f1=sinc(t1/pi);
subplot(311);
stem(t1,f1);
xlabel("kTs");
ylabel("f(kTs)");
title("sa(t)=sinc(t/pi)的采样信号");
subplot(312);
plot(t,fa)
xlabel("t");
ylabel("fa(t)");
title("由sa(t)=sinc(t/pi)的采样信号重构sa(t)");
subplot(313);
plot(t,error);
xlabel("t");
ylabel("error(t)");
tightlayout()
我的问题是该代码得出的结果图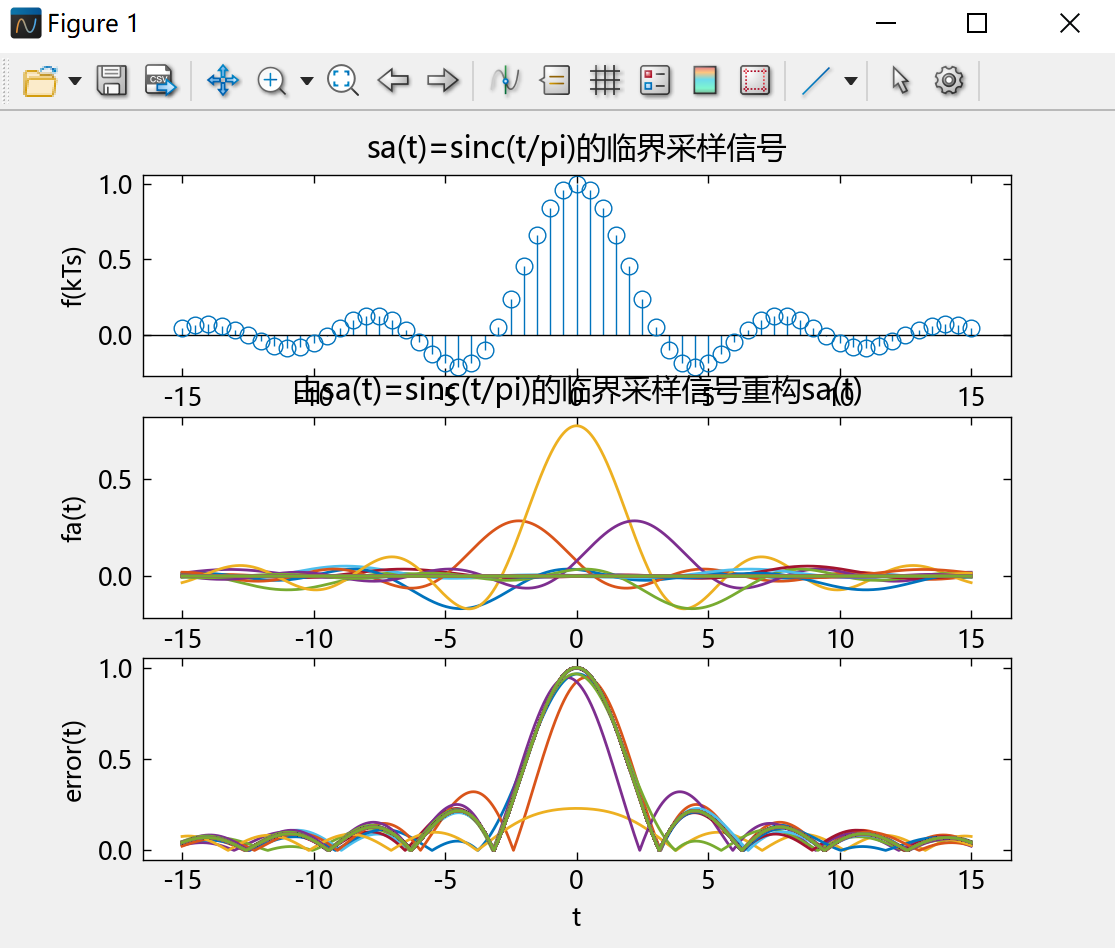 与书上的
与书上的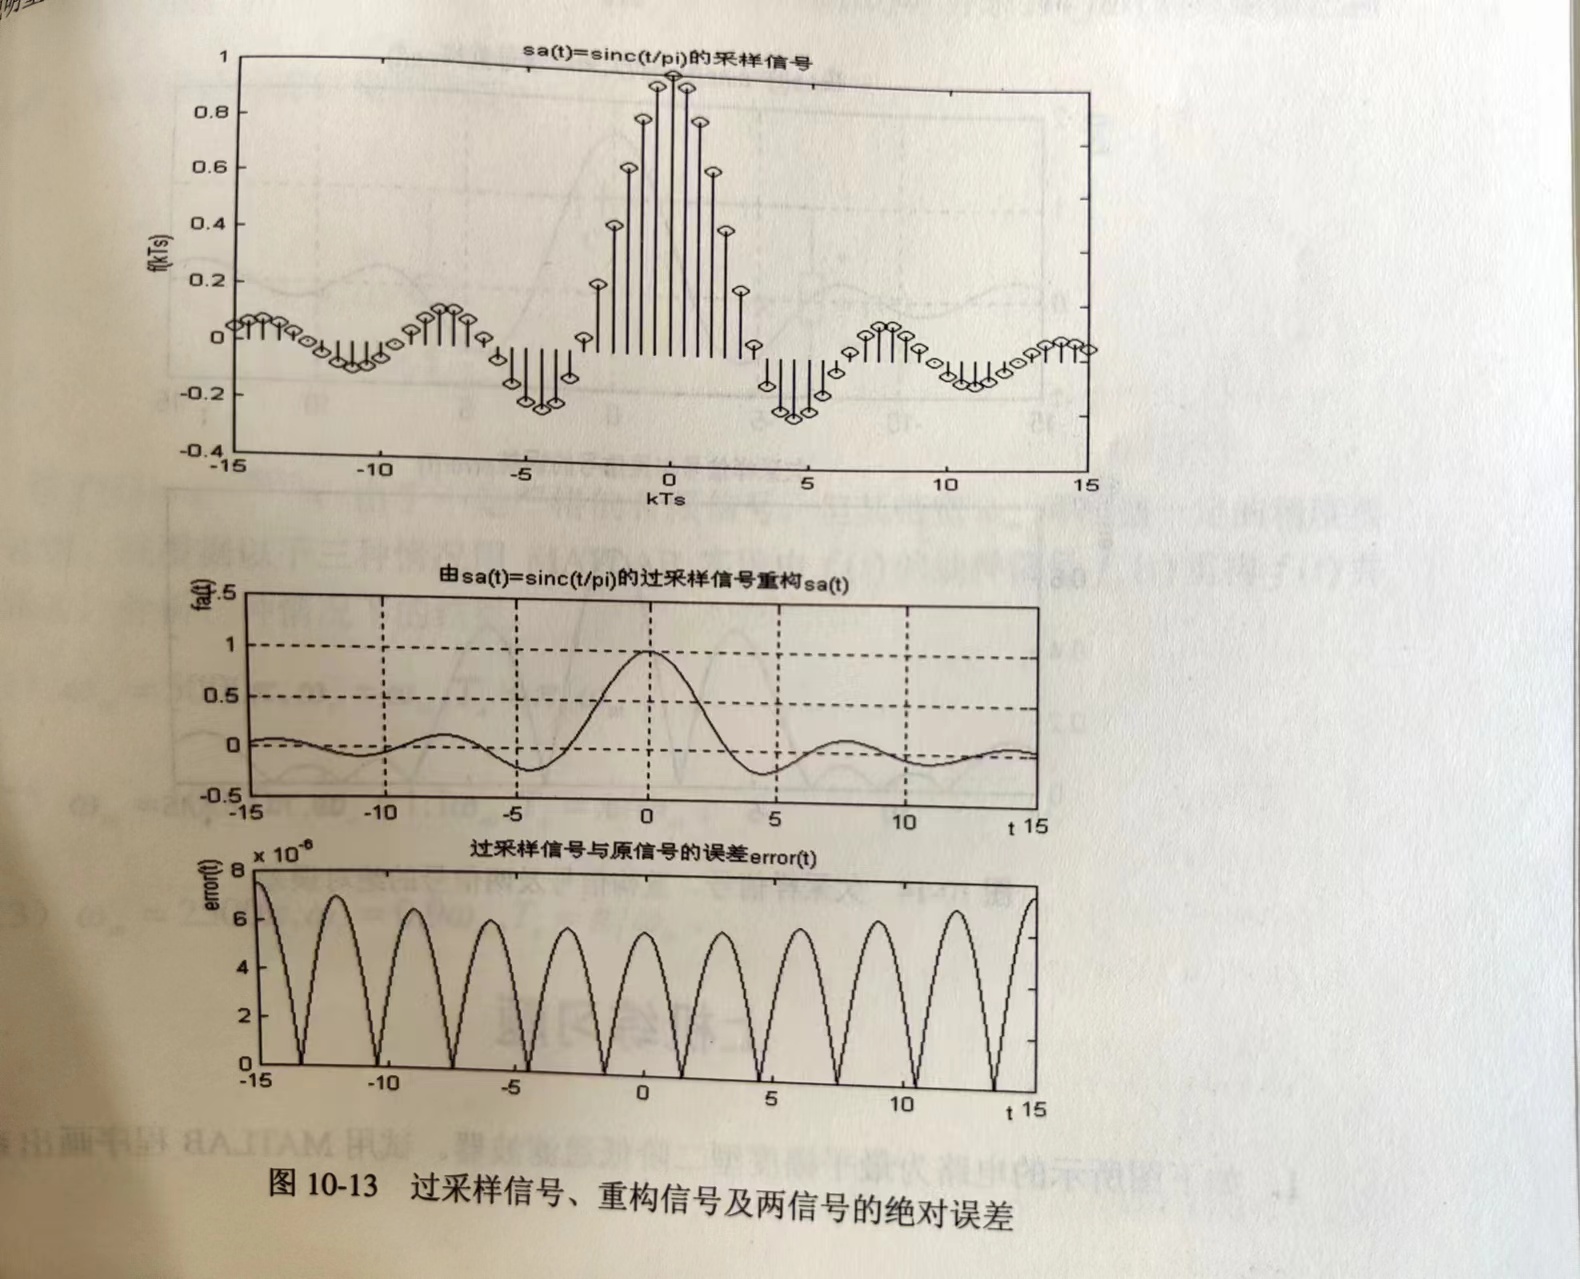 不一样,不知道问题出在哪里?求解答
'%3e%3cg%20id='Group'%3e%3cpath%20id='Vector'%20d='M12%2012.0002C13.933%2012.0002%2015.5%2010.4331%2015.5%208.50009C15.5%206.56705%2013.933%205%2012%205C10.067%205%208.5%206.56705%208.5%208.50009C8.5%2010.4331%2010.067%2012.0002%2012%2012.0002Z'%20fill='white'%20stroke='white'%20stroke-width='1.40002'%20stroke-linecap='round'%20stroke-linejoin='round'/%3e%3cpath%20id='Vector_2'%20d='M19.5%2021.6877C19.5%2019.6985%2018.7098%2017.7908%2017.3033%2016.3843C15.8968%2014.9777%2013.9891%2014.1875%2012%2014.1875C10.0109%2014.1875%208.10322%2014.9777%206.6967%2016.3843C5.29018%2017.7908%204.5%2019.6985%204.5%2021.6877'%20stroke='white'%20stroke-width='1.87503'%20stroke-linecap='round'%20stroke-linejoin='round'/%3e%3cpath%20id='Vector_3'%20d='M12%2014.1875C10.0109%2014.1875%208.10322%2014.9777%206.6967%2016.3843C5.29018%2017.7908%204.5%2019.6985%204.5%2021.6877H19.5C19.5%2019.6985%2018.7098%2017.7908%2017.3033%2016.3843C15.8968%2014.9777%2013.9891%2014.1875%2012%2014.1875Z'%20fill='white'%20stroke='white'%20stroke-width='1.87503'%20stroke-linecap='round'%20stroke-linejoin='round'/%3e%3c/g%3e%3c/g%3e%3crect%20x='2.15'%20y='2.15'%20width='19.7'%20height='19.7'%20rx='9.85'%20stroke='%23F96A02'%20stroke-width='0.3'/%3e%3c/g%3e%3c/g%3e%3cdefs%3e%3cclipPath%20id='clip0_474_37108'%3e%3crect%20x='2'%20y='2'%20width='20'%20height='20'%20rx='10'%20fill='white'/%3e%3c/clipPath%3e%3c/defs%3e%3c/svg%3e)
'%3e%3cg%20id='Group%201882'%3e%3cg%20id='Group%201881'%3e%3cpath%20id='Vector'%20d='M16.3334%202.02441H1.66675V14.5244H6.91675L9.00008%2016.6077L11.0834%2014.5244H16.3334V2.02441Z'%20stroke='white'%20stroke-width='1.25'%20stroke-linecap='round'%20stroke-linejoin='round'/%3e%3c/g%3e%3cpath%20id='&%23239;&%23188;&%23159;'%20d='M9.13224%203.95443C9.90024%203.95443%2010.5242%204.15843%2011.0042%204.59043C11.4842%205.01043%2011.7242%205.58643%2011.7242%206.30643C11.7242%206.89443%2011.5682%207.38643%2011.2682%207.77043C11.1602%207.90243%2010.8242%208.21443%2010.2602%208.70643C10.0322%208.89843%209.86424%209.11443%209.75624%209.33043C9.62424%209.57043%209.56424%209.83443%209.56424%2010.1224V10.3264H8.28024V10.1224C8.28024%209.67843%208.35224%209.29443%208.52024%208.98243C8.67624%208.64643%209.13224%208.15443%209.87624%207.49443L10.0802%207.26643C10.2962%206.99043%2010.4162%206.70243%2010.4162%206.39043C10.4162%205.97043%2010.2962%205.64643%2010.0682%205.40643C9.82824%205.16643%209.48024%205.04643%209.04824%205.04643C8.50824%205.04643%208.11224%205.21443%207.87224%205.56243C7.65624%205.85043%207.54824%206.25843%207.54824%206.78643H6.28824C6.28824%205.91043%206.54024%205.22643%207.04424%204.72243C7.54824%204.20643%208.24424%203.95443%209.13224%203.95443ZM8.91624%2010.9744C9.16824%2010.9744%209.38424%2011.0464%209.55224%2011.2144C9.72024%2011.3704%209.80424%2011.5744%209.80424%2011.8264C9.80424%2012.0784%209.70824%2012.2824%209.54024%2012.4504C9.37224%2012.6064%209.15624%2012.6904%208.91624%2012.6904C8.67624%2012.6904%208.46024%2012.6064%208.29224%2012.4384C8.12424%2012.2704%208.04024%2012.0664%208.04024%2011.8264C8.04024%2011.5744%208.12424%2011.3704%208.29224%2011.2144C8.46024%2011.0464%208.67624%2010.9744%208.91624%2010.9744Z'%20fill='white'/%3e%3c/g%3e%3c/g%3e%3cdefs%3e%3cclipPath%20id='clip0_387_16301'%3e%3crect%20width='18'%20height='18'%20fill='white'/%3e%3c/clipPath%3e%3c/defs%3e%3c/svg%3e) 我要发帖
我要发帖  资料中心
资料中心 '%20stroke='url(%23paint1_linear_641_37213)'%20stroke-width='1.83333'%20stroke-linecap='round'%20stroke-linejoin='round'/%3e%3cpath%20id='Vector_2'%20d='M7.38135%208.58811C7.38135%207.2561%208.46118%206.17627%209.79319%206.17627C11.1252%206.17627%2012.205%207.2561%2012.205%208.58811C12.205%209.92012%2011.1252%2011%209.79319%2011V12.4471'%20stroke='white'%20stroke-width='1.83333'%20stroke-linecap='round'%20stroke-linejoin='round'/%3e%3cpath%20id='Vector_3'%20d='M9.79492%2015.3398V15.8222'%20stroke='white'%20stroke-width='1.83333'%20stroke-linecap='round'%20stroke-linejoin='round'/%3e%3c/g%3e%3c/g%3e%3cdefs%3e%3clinearGradient%20id='paint0_linear_641_37213'%20x1='11'%20y1='1.83496'%20x2='11'%20y2='20.165'%20gradientUnits='userSpaceOnUse'%3e%3cstop%20stop-color='%23FF9849'/%3e%3cstop%20offset='1'%20stop-color='%23FF6705'/%3e%3c/linearGradient%3e%3clinearGradient%20id='paint1_linear_641_37213'%20x1='11'%20y1='1.83496'%20x2='11'%20y2='20.165'%20gradientUnits='userSpaceOnUse'%3e%3cstop%20stop-color='%23FF9849'/%3e%3cstop%20offset='1'%20stop-color='%23FF6705'/%3e%3c/linearGradient%3e%3c/defs%3e%3c/svg%3e) FAQ
FAQ '%3e%3cg%20id='Group%201880'%3e%3cpath%20id='Vector'%20d='M10.9997%2020.1654C16.0623%2020.1654%2020.1663%2016.0613%2020.1663%2010.9987C20.1663%205.93609%2016.0623%201.83203%2010.9997%201.83203C5.93706%201.83203%201.83301%205.93609%201.83301%2010.9987C1.83301%2012.2416%202.08036%2013.4267%202.52851%2014.5074C2.7599%2015.0654%203.04482%2015.5956%203.37687%2016.0917C3.48831%2016.2581%203.27925%2017.3105%202.74967%2019.2487C4.68792%2018.7191%205.74025%2018.51%205.90672%2018.6215C6.40273%2018.9535%206.93293%2019.2385%207.49095%2019.4698C8.5717%2019.918%209.75681%2020.1654%2010.9997%2020.1654Z'%20fill='url(%23paint0_linear_369_8392)'%20stroke='url(%23paint1_linear_369_8392)'%20stroke-width='1.83333'%20stroke-linejoin='round'/%3e%3cpath%20id='Vector_2'%20d='M7.61035%209.08398H15.3009'%20stroke='white'%20stroke-width='1.83333'%20stroke-linecap='round'%20stroke-linejoin='round'/%3e%3cpath%20id='Vector_3'%20d='M10.0132%207.21289L8.67773%2014.7866'%20stroke='white'%20stroke-width='1.83333'%20stroke-linecap='round'%20stroke-linejoin='round'/%3e%3cpath%20id='Vector_4'%20d='M13.2212%207.21289L11.8857%2014.7866'%20stroke='white'%20stroke-width='1.83333'%20stroke-linecap='round'%20stroke-linejoin='round'/%3e%3cpath%20id='Vector_5'%20d='M6.69434%2012.832H14.3848'%20stroke='white'%20stroke-width='1.83333'%20stroke-linecap='round'%20stroke-linejoin='round'/%3e%3c/g%3e%3c/g%3e%3cdefs%3e%3clinearGradient%20id='paint0_linear_369_8392'%20x1='10.9997'%20y1='1.83203'%20x2='10.9997'%20y2='20.1654'%20gradientUnits='userSpaceOnUse'%3e%3cstop%20stop-color='%23FF9849'/%3e%3cstop%20offset='1'%20stop-color='%23FF6705'/%3e%3c/linearGradient%3e%3clinearGradient%20id='paint1_linear_369_8392'%20x1='10.9997'%20y1='1.83203'%20x2='10.9997'%20y2='20.1654'%20gradientUnits='userSpaceOnUse'%3e%3cstop%20stop-color='%23FF9849'/%3e%3cstop%20offset='1'%20stop-color='%23FF6705'/%3e%3c/linearGradient%3e%3cclipPath%20id='clip0_369_8392'%3e%3crect%20width='22'%20height='22'%20fill='white'/%3e%3c/clipPath%3e%3c/defs%3e%3c/svg%3e) 热门帖子
热门帖子 '/%3e%3c/g%3e%3c/g%3e%3cdefs%3e%3clinearGradient%20id='paint0_linear_369_8417'%20x1='11'%20y1='2.5'%20x2='11'%20y2='19.5'%20gradientUnits='userSpaceOnUse'%3e%3cstop%20stop-color='%23FF9849'/%3e%3cstop%20offset='1'%20stop-color='%23FF6705'/%3e%3c/linearGradient%3e%3c/defs%3e%3c/svg%3e) 主要贡献者
主要贡献者